
Creating a Jupyter notebook widget
This post will provide a step-by-step tutorial for creating and running a Jupyter widget.
The Jupyter widget we’ll create in this example will allow us to add Britecharts to our Jupyter notebook.
Jupyter notebook is increasingly becoming one of my main tools and I wanted to be able to extend the basic Jupyter notebook and create additional widgets / use external javascript libraries inside Jupyter notebook.
There are a few tutorials about creating Jupyter widgets in ipywidgets.readthedocs.io or the JS extension part in this Jupyter github book.
Also, you can go over the source code of some ipwidgets such as ipyleaflet or gmaps and learn from that code how to create Jupyter widgets.
Another tutorial shows how to embed mapbox plots as part of the notebook.
All of these are great tutorials, but I was looking for a tutorial teaching how to build a simple widget, from scratch, that uses an external javascript library as part of the Jupyter notebook. That will be covered in this tutorial.
Source code can be found on github.
Create a dev environment for the new widget
For this tutorial we will need to install the jupyter package, ipywidgets for our jupyter notebook and widgets, and cookiecutter for the Jupyter notebook widget template.
We will start by creating a virtual / conda environment with the following packages:
jupyter
ipywidgets
cookiecutter
Creating the template for our widget
In my opinion, the best place to start our work would be to use a pre-defined template for our widget. This template will already have most of what we will need.
We will use the Widget Cookiecutter template for our project.
Run the following command in order to create the base project:
cookiecutter https://github.com/jupyter/widget-cookiecutter.gitAfter running the cookiecutter command you will need to add some basic information about your custom Jupyter widget:
author_name []: Tzahi Vidas
author_email []:
github_project_name [jupyter-widget-example]: jupyter_britecharts_widget_tutorial
github_organization_name [jupyter]: kazuar
python_package_name [ipywidgetexample]: jupyter_britecharts_widget_tutorial
npm_package_name [jupyter-widget-example]: jupyter_britecharts_widget_tutorial
npm_package_version [0.1.0]:
project_short_description [A Custom Jupyter Widget Library]: A tutorial for creating Jupyter widget for Britecharts
Once you’re done you’ll have the following folders structure under your new directory (jupyter_britecharts_widget_tutorial):
.
├── MANIFEST.in
├── README.md
├── RELEASE.md
├── js
│   ├── README.md
│   ├── package.json
│   ├── src
│   │   ├── embed.js
│   │   ├── example.js
│   │   ├── extension.js
│   │   └── index.js
│   └── webpack.config.js
├── jupyter_britecharts_widget_tutorial
│   ├── __init__.py
│   ├── _version.py
│   └── example.py
├── setup.cfg
└── setup.py
As you can see from the folder tree, the widget has two parts which are the python code and the javascript code. When we run the widget, we will run python code in our notebook and that code will sync with the javascript code, which will render the output in our notebook.
Running the example widget
The cookiecutter jupyter widget has an integrated “hello world” example. Just as a sanity check, let’s try to run this example. In order to run it, we need to install the package in our virtual env and enable it for our jupyter notebook.
Build and install the package with the following commands:
python setup.py build
pip install -e .
Enable the widget for Jupyter notebook:
jupyter nbextension install --py --symlink --sys-prefix jupyter_britecharts_widget_tutorial
jupyter nbextension enable --py --sys-prefix jupyter_britecharts_widget_tutorial
Start the Jupyter notebook:
jupyter notebookIn the browser, open a new notebook and insert the following code:
from jupyter_britecharts_widget_tutorial import example
hello_world = example.HelloWorld()
hello_world
The code will create the text “Hello World!” in the output cell:
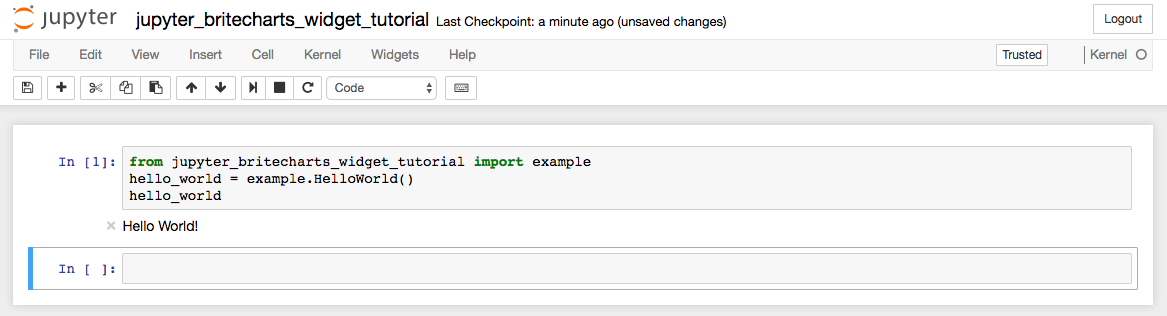
Next, we’ll add the required javascript libraries for our widget.
Add required npm packages to our project
Since pull request 1047, Jupyter notebook is using Webpack for javascript bundling. This change allows the notebook to use NPM packages such as d3 and in our case (for this tutorial), it will allow us to add the Britecharts package to our Jupyter widget module.
The package dependencies are set in the js/package.json file. The package.json file is being used by setup.py, and during the build step it will install the dependencies specified in package.json using npm.
Open the js/package.json file and add the britecharts and d3 pacakges to the “dependencies” section. The “dependencies” section should look like this:
"dependencies": {
	"jupyter-js-widgets": "^2.1.4",
	"underscore": "^1.8.3",
	"britecharts": "^1.7.2",
	"d3": "^4.9.1"
}
Also, in order to easily import javascript and css in our widget, add the following packages to the “devDependencies” section:
babel-clibabel-corebabel-loaderbabel-preset-es2015babel-preset-stage-0style-loadercss-loader
The “devDependencies” section should look like this:
"devDependencies": {
	"babel-cli": "^6.24.1",
	"babel-core": "^6.25.0",
	"babel-loader": "^7.1.1",
	"babel-preset-es2015": "^6.24.1",
	"babel-preset-stage-0": "^6.24.1",
	"style-loader": "^0.18.2",
	"css-loader": "^0.28.4",
	"json-loader": "^0.5.4",
	"webpack": "^1.12.14"
}
We also need to make sure that we configure the appropriate “loaders” for the different resources that we need in our javascript files. This can be done in the webpack.config.js file.
var loaders = [
    { test: /\.css$/, loader: "style-loader!css-loader" },
    { test: /\.less$/, loader: "style-loader!css-loader!less-loader" },
    { test: /\.json$/, loader: 'json-loader' },
    { test: /\.js$/, loader: 'babel-loader', query: {presets: ['es2015', 'stage-0']}, exclude: /node_modules/ }
];
Create the python file for interacting with the widget
The python side of the widget will basically be a class that is synced with a javascript model.
When you call the widget in the notebook, the python module will call the javascript model which will eventually be rendered in the browser. You can find more details about this process here.
In our example, we will write a simple Python class. In order to use this class we will have to pass it a list of values. This list of values will be used by the class to create a bar chart in the notebook.
Create a new python file with the name “britecharts_jupyter_widget.py” in the <package_name>\<package_name> folder, “jupyter_britecharts_widget_tutorial\jupyter_britecharts_widget_tutorial” in our example (this is same folder that has the “example.py” file).
For this model we will need the following packages:
- ipywidgets - our class will inherit from “ipywidgets.DOMWidget”
- traitlets - as “Traitlets powers the configuration system of IPython and Jupyter and the declarative API of IPython interactive widgets”. We will use it to sync our model with the javascript model.
Add the following imports at the beginning of the file:
import ipywidgets as widgets
from traitlets import Unicode
from traitlets import default
from traitlets import List
Create a new class for the bar chart that we want to display.
Because we want our widget to be displayed in the Jupyter notebook, our class must inherit from ipwidgets.DOMWidget.
Once we inherit from DOMWidget, we will need to associate it with the front-end using the following members:
_view_name_view_module_model_name_model_module
Each attribute will be a traitlets object that will have the sync=True option for handling the synchonization of the value with the browser.
We also want to add an attribute that will save our _model_data for the bar chart.
The traitlets package will help us to declare the types of each of these attributes which is required for the widget.
class BarChart(widgets.DOMWidget):

    _view_name = Unicode('BarChartView').tag(sync=True)
    _model_name = Unicode('BarChartModel').tag(sync=True)
    _view_module = Unicode('jupyter_britecharts_widget_tutorial').tag(sync=True)
    _model_module = Unicode('jupyter_britecharts_widget_tutorial').tag(sync=True)
    _model_data = List([]).tag(sync=True)
We’ll add two methods:
_default_layout- controls the layout of the output cell and make enough space for the bar chartset_data- allows the user to set their own data for the bar chart
The full code in the file should be:
import ipywidgets as widgets
from traitlets import Unicode
from traitlets import default
from traitlets import List


class BarChart(widgets.DOMWidget):

    _view_name = Unicode('BarChartView').tag(sync=True)
    _model_name = Unicode('BarChartModel').tag(sync=True)
    _view_module = Unicode('jupyter_britecharts_widget_tutorial').tag(sync=True)
    _model_module = Unicode('jupyter_britecharts_widget_tutorial').tag(sync=True)
    _model_data = List([]).tag(sync=True)

    @default('layout')
    def _default_layout(self):
        return widgets.Layout(height='400px', align_self='stretch')

    def set_data(self, js_data):
        self._model_data = js_data
Create the javascript file for displaying a barchart
Lastly, we will create the front-end side of our widget. We need to create two objects:
- widget model - the widget model defines some default values that can be overriden by the python class
- widget view - the widget view will be responsible for the rendering and creation of the bar chart itself
Create a new file called britecharts_jupyter_widget.js in the js folder.
Start by importing jupyter-js-widgets, d3, britecharts bar chart, css, etc.:
var widgets = require('jupyter-js-widgets');
var _ = require('underscore');
var britechart_css = require('britecharts/dist/css/britecharts.min.css');

import * as d3 from 'd3';
import bar from 'britecharts/dist/umd/bar.min.js';
import colors from 'britecharts/dist/umd/colors.min.js';
The widget model will extend the DOMWidgetModel from jupyter-js-widgets and set the default values:
var BarChartModel = widgets.DOMWidgetModel.extend({
    defaults: _.extend(_.result(this, 'widgets.DOMWidgetModel.prototype.defaults'), {
        _model_name : 'BarChartModel',
        _view_name : 'BarChartView',
        _model_module : 'jupyter_britecharts_widget_tutorial',
        _view_module : 'jupyter_britecharts_widget_tutorial',
    })
});
The widget view will handle rendering the bar chart in the browser.
this.elm is the HTML container our widget will use to hold the bar chart.
After we are done setting up the bar chart object, we’ll combine it with our data in the bar chart container.
The settings for the bar chart can be changed according to your preferences. In this example, we added a color scheme for the bar chart that we’ve imported earlier on. For now, to make things simple, we will hard code all these settings in the javascript file.
var BarChartView = widgets.DOMWidgetView.extend({
    render: function() {
        let barChart = new bar();
        let barContainer = d3.select(this.el);
        let containerWidth = "600";

        barChart
            .margin({
                left: 120,
                right: 20,
                top: 20,
                bottom: 10
            })
            .horizontal(true)
            .usePercentage(true)
            .percentageAxisToMaxRatio(1.3)
            .width(containerWidth)
            .height(400);
        barChart.colorSchema(colors.colorSchemas.extendedOrangeColorSchema);
        var data = this.model.get("_model_data");
        barContainer.datum(data).call(barChart);
    }
});
The full code in the file should look like this:
var widgets = require('jupyter-js-widgets');
var _ = require('underscore');
var britechart_css = require('britecharts/dist/css/britecharts.min.css');

import * as d3 from 'd3';
import bar from 'britecharts/dist/umd/bar.min.js';
import colors from 'britecharts/dist/umd/colors.min.js';

var BarChartModel = widgets.DOMWidgetModel.extend({
    defaults: _.extend(_.result(this, 'widgets.DOMWidgetModel.prototype.defaults'), {
        _model_name : 'BarChartModel',
        _view_name : 'BarChartView',
        _model_module : 'jupyter_britecharts_widget_tutorial',
        _view_module : 'jupyter_britecharts_widget_tutorial',
        _model_module_version : '0.1.0',
        _view_module_version : '0.1.0'
    })
});

// Custom View. Renders the widget model.
var BarChartView = widgets.DOMWidgetView.extend({
    render: function() {
        let barChart = new bar();
        let barContainer = d3.select(this.el);

        barChart
            .margin({
                left: 120,
                right: 20,
                top: 20,
                bottom: 10
            })
            .horizontal(true)
            .usePercentage(true)
            .percentageAxisToMaxRatio(1.3)
            .width(600)
            .height(400);
        barChart.colorSchema(colors.colorSchemas.extendedOrangeColorSchema);
        var data = this.model.get("_model_data");
        barContainer.datum(data).call(barChart);
    }
});

module.exports = {
    BarChartModel: BarChartModel,
    BarChartView: BarChartView
};
The export modules at the end of the file will allow our BarChartModel and BarChartView to be imported by other files.
Replace the places where example.js was being imported in embed.js and index.js.
embed.js:
module.exports = require('./britecharts_jupyter_widget.js');
module.exports['version'] = require('../package.json').version;index.js:
__webpack_public_path__ = document.querySelector('body').getAttribute('data-base-url') + 'nbextensions/jupyter_britecharts_widget_tutorial/';

module.exports = require('./britecharts_jupyter_widget.js');
module.exports['version'] = require('../package.json').version;
Running the full example
Now we’re ready to run the full example.
First, uninstall the widget from our jupyter notebook so we can clean the environment before re-building and re-installing it:
jupyter nbextension uninstall --py --sys-prefix jupyter_britecharts_widget_tutorialNext, delete the static folder that gets generated in the setup.py build step:
rm -rf jupyter_britecharts_widget_tutorial/static/Re-run the build step and install the python package again:
python setup.py build
pip install -e .
Re-install the widget and enable it for our jupyter notebook:
jupyter nbextension install --py --symlink --sys-prefix jupyter_britecharts_widget_tutorial
jupyter nbextension enable --py --sys-prefix jupyter_britecharts_widget_tutorial
Start the jupyter notebook again by running:
jupyter notebookNow we need some code to populate our bar chart. We’ll use coding languages and random numbers as an example.
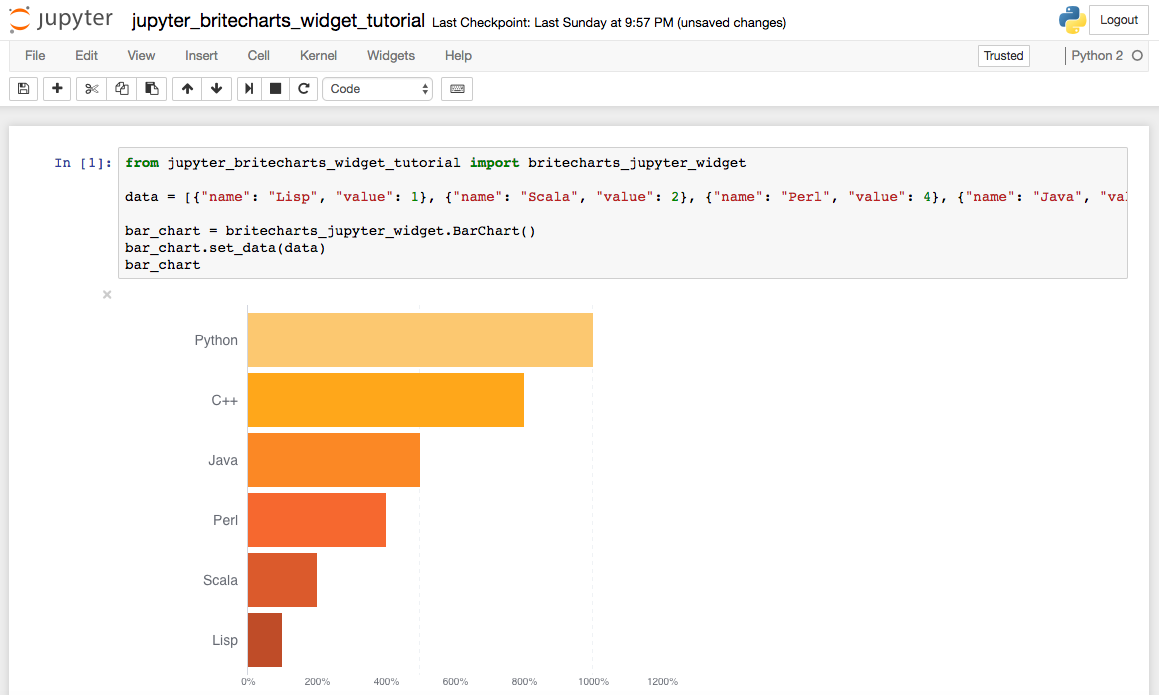
In the browser, open a new notebook and run the following code in the notebook cells:
from jupyter_britecharts_widget_tutorial import britecharts_jupyter_widget

data = [{"name": "Lisp", "value": 1}, {"name": "Scala", "value": 2}, {"name": "Perl", "value": 4}, {"name": "Java", "value": 5}, {"name": "C++", "value": 8}, {"name": "Python", "value": 10}]

bar_chart = britecharts_jupyter_widget.BarChart()
bar_chart.set_data(data)
bar_chart
Run the code in the cell and you’ll see the barchart in the output cell of the notebook:
Debugging
Debugging the jupyter widget can be a little tricky as there are many components and you need to know where to look in order to find the error.
I use the following tools to debug my Jupyter widgets:
- If the issue is with the Python code, you will be able to see the error in the Jupyter notebook console output.
- If the issue is with the Javascript code, you will either find the error during the “setup.py build” step or in the browser using the browser’s developer tools -> javascript console, firebug, etc.
Summary
This was a very basic example of creating a Juyper notebook widget that uses external javascript libraries. Britecharts was used for this example as the external javascript library, but the same method can be used with other external javascript libraries.
Source code can be found on github.