
Visualize your trip with Flask and Mapbox
Following my recent trip to Iceland (which I highly recommend), I wanted to visualize the trip using a map, complete with the route and stop locations along the way.
Source code
Full source code for this project can be found on Github
Requirements
- Flask web framework - Python web framework for the backend server
- Requests - Python package for performing Mapbox API queries
- GeoJSON - Python package for creating GeoJSON objects
Create the environment
Signup with a new / existing user in Mapbox
In order to use the Mapbox API you will need an access key, and for that you need to have a user account. For smaller projects, I recommend using the starter plan which is free to use (https://www.mapbox.com/pricing/)
Once your account is set up, you can find your API key by following this URL https://www.mapbox.com/studio/. It will be under the “Access Token” section.
Prepare python environment
Create a virtual environment with the following packages:
click==6.6
Flask==0.11.1
geojson==1.3.3
itsdangerous==0.24
Jinja2==2.8
MarkupSafe==0.23
requests==2.11.1
Werkzeug==0.11.11
Create a flask project
Create the folders for the project:
/flask_mapbox
    /static
    /templates
We’ll put our main files in the flask_mapbox folder.
The static folder will be used for CSS, Javascript and images, while the
templates folder will be used for HTML files
Create a server.py file for the python code:
from flask import Flask, request, session, g, redirect, \
    url_for, abort, render_template, flash

app = Flask(__name__)
app.config.from_object(__name__)
Create a bash script to that will set the environment variables needed to start the server:
# start.sh

export FLASK_APP=server.py
export FLASK_DEBUG=1
flask run
That’s it, the server is ready to run!
Open the command line console and run the start.sh file:
sh start.shBrowse to http://127.0.0.1:5000/. For now, you’ll only get a 404 page not found error as we are not doing anything yet.
Display a simple map
In this part you will learn how to display a map using the Mapbox API.
As we don’t want to put the API key as part of the code, start by putting it in a configuration file.
Create a new file with the name settings.py in the root folder of the project and add the following code:
# settings.py

MAPBOX_ACCESS_KEY = '<MAPBOX_ACCESS_KEY>'
Add an additional environment variable in start.sh that will point to settings.py.
export APP_CONFIG_FILE=settings.pystart.sh should look like:
# start.sh

export FLASK_APP=server.py
export FLASK_DEBUG=1
export APP_CONFIG_FILE=settings.py
flask run
In server.py read the settings.py configuration file from the environment variable and get the access key from the configuration file:
# server.py

app.config.from_envvar('APP_CONFIG_FILE', silent=True)

MAPBOX_ACCESS_KEY = app.config['MAPBOX_ACCESS_KEY']
Next, create a function in the server.py file that will route to the new template templates/mapbox_js.html.
The function should also send the Mapbox access key to the template.
# server.py

@app.route('/mapbox_js')
def mapbox_js():
    return render_template(
        'mapbox_js.html',
        ACCESS_KEY=MAPBOX_ACCESS_KEY
    )
Finally, we want to create the HTML file that will show the map.
In the templates folder, create a new HTML file with the name mapbox_js.html for showing the map.
-
In the HTML header we will load the css and javascript from Mapbox.
-
In the JavaScript section of the HTML we will set the Mapbox access key that we got from the server, and create a new map object in the
<div id="map">element. -
We will set the map to show Iceland (
[65.0,-18.73]) with zoom level of7.
The mapbox_js.html file should look like this:
# templates/mapbox_js.html

<html>
    <head>
        <meta name='viewport' content='initial-scale=1,maximum-scale=1,user-scalable=no' />
        <link href='https://api.tiles.mapbox.com/mapbox.js/v2.2.3/mapbox.css' rel='stylesheet' />
        <script src='https://api.tiles.mapbox.com/mapbox.js/v2.2.3/mapbox.js'></script>
        <script type="text/javascript" src="https://code.jquery.com/jquery-2.1.4.min.js"></script>
        <style>
            body { margin:0; padding:0; }
            #map { width: 100%; height: 700px; }
        </style>
    </head>
    <body>
        <div id="map"></div>
        <script>
            L.mapbox.accessToken = '{{ACCESS_KEY}}';

            var map = L.mapbox.map('map', 'mapbox.streets', {
              scrollWheelZoom: false,
              zoomControl: false
            }).setView([65.0,-18.73], 7);
        </script>
    </body>
</html>
You can start the server again by running the start.sh file:
sh start.shBrowsing to http://127.0.0.1:5000/mapbox_js will show a map of Iceland:

Show the route on the map
In order to show a route on the map we will use the Mapbox routing API.
Start by gathering the geo-coordinate points along our route around Iceland’s ring road.
We will use these geo-coordinates when performing our Mapbox API request.
Add the following code to server.py:
# server.py

ROUTE = [
    {"lat": 64.0027441, "long": -22.7066262},
    {"lat": 64.0317168, "long": -22.1092311},
    {"lat": 63.99879, "long": -21.18802},
    {"lat": 63.4194089, "long": -19.0184548},
    {"lat": 63.5302354, "long": -18.8904333},
    {"lat": 64.2538507, "long": -15.2222918},
    {"lat": 64.913435, "long": -14.01951},
    {"lat": 65.2622588, "long": -14.0179538},
    {"lat": 65.2640083, "long": -14.4037548},
    {"lat": 66.0427545, "long": -17.3624953},
    {"lat": 65.659786, "long": -20.723364},
    {"lat": 65.3958953, "long": -20.9580216},
    {"lat": 65.0722555, "long": -21.9704238},
    {"lat": 65.0189519, "long": -22.8767959},
    {"lat": 64.8929619, "long": -23.7260926},
    {"lat": 64.785334, "long": -23.905765},
    {"lat": 64.174537, "long": -21.6480148},
    {"lat": 64.0792223, "long": -20.7535337},
    {"lat": 64.14586, "long": -21.93955},
]
In order to get the driving direction from Mapbox we’ll create an API request using the geo-coordinates and Mapbox access key.
This is the template for the API call:
Add the following code to server.py:
# server.py

# Mapbox driving direction API call
ROUTE_URL = "https://api.mapbox.com/directions/v5/mapbox/driving/{0}.json?access_token={1}&overview=full&geometries=geojson"

def create_route_url():
    # Create a string with all the geo coordinates
    lat_longs = ";".join(["{0},{1}".format(point["long"], point["lat"]) for point in ROUTE])
    # Create a url with the geo coordinates and access token
    url = ROUTE_URL.format(lat_longs, MAPBOX_ACCESS_KEY)
    return url
The function create_route_url will create the API URL with all of our geo-coordinates and the Mapbox access token.
The get_route_data function will use requests to run the API request and return the results as a GeoJSON object:
# server.py

def get_route_data():
    # Get the route url
    route_url = create_route_url()
    # Perform a GET request to the route API
    result = requests.get(route_url)
    # Convert the return value to JSON
    data = result.json()

    # Create a geo json object from the routing data
    geometry = data["routes"][0]["geometry"]
    route_data = Feature(geometry = geometry, properties = {})

    return route_data
We’ll modify the previous mapbox_js function and add the routing data to the render_template function:
# server.py

@app.route('/mapbox_js')
def mapbox_js():
    route_data = get_route_data()

    return render_template('mapbox_js.html',
        ACCESS_KEY=MAPBOX_ACCESS_KEY,
        route_data=route_data
    )
In the mapbox_js.html file add a Mapbox feature layer with the routing data.
Add the following code to the JavaScript section in mapbox_js.html:
// templates/mapbox_js.html

L.mapbox.accessToken = '{{ACCESS_KEY}}';

var map = L.mapbox.map('map', 'mapbox.streets', {
  scrollWheelZoom: false,
  zoomControl: false
}).setView([65.0,-18.73], 7);

L.mapbox.featureLayer({{ route_data|safe }}).addTo(map);
Start the server again by running the start.sh file:
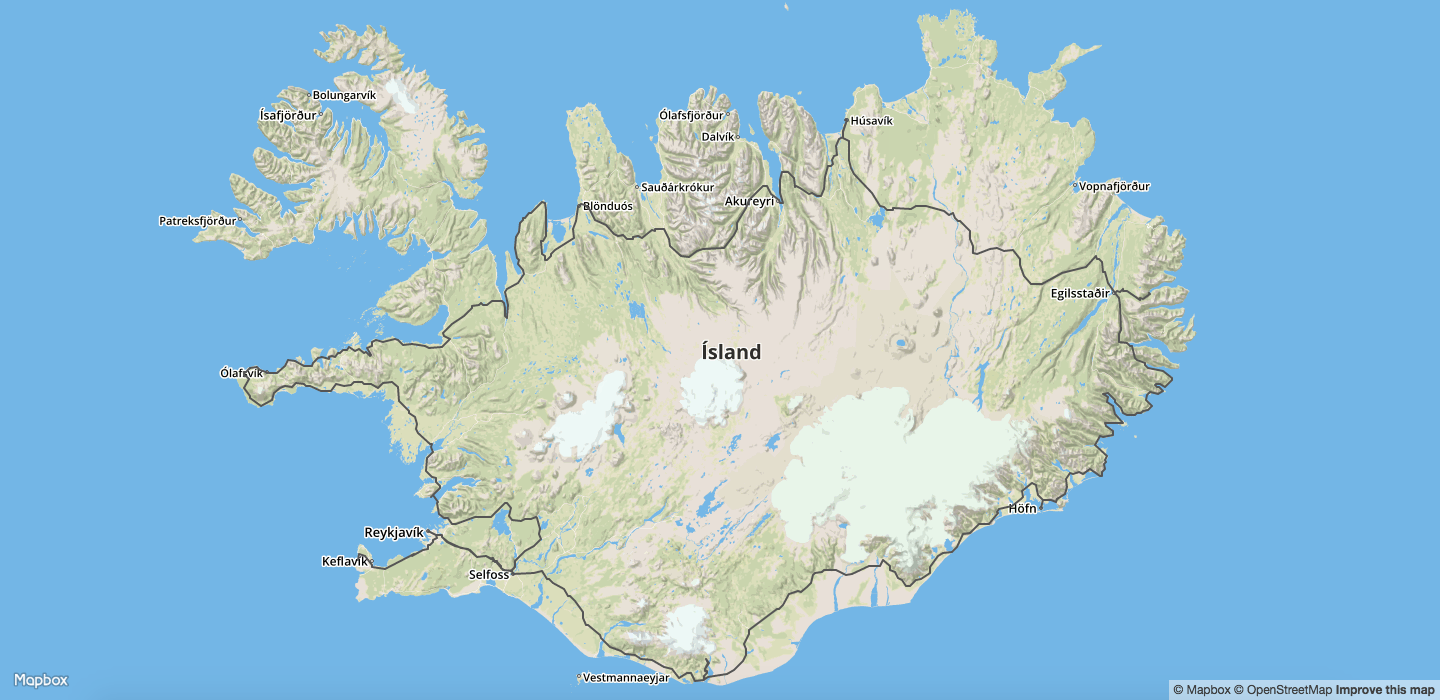
sh start.shBrowsing to http://127.0.0.1:5000/mapbox_js will show a page with a Mapbox map and the routing (the black line) starting in Keflavík International Airport (KEF), going around Iceland and ending in Reykjavík:
Add location markers on the map
Next, we’ll add location markers for cities and locations along the route.
We’ll edit the ROUTE dictionary with the location names (name) and a boolean to signal if this is a stop location (is_stop_location) for locations that we stopped in along the way.
In server.py edit the data in ROUTE:
# server.py

ROUTE = [
    {"lat": 64.0027441, "long": -22.7066262, "name": "Keflavik Airport", "is_stop_location": True},
    {"lat": 64.0317168, "long": -22.1092311, "name": "Hafnarfjordur", "is_stop_location": True},
    {"lat": 63.99879, "long": -21.18802, "name": "Hveragerdi", "is_stop_location": True},
    {"lat": 63.4194089, "long": -19.0184548, "name": "Vik", "is_stop_location": True},
    {"lat": 63.5302354, "long": -18.8904333, "name": "Thakgil", "is_stop_location": True},
    {"lat": 64.2538507, "long": -15.2222918, "name": "Hofn", "is_stop_location": True},
    {"lat": 64.913435, "long": -14.01951, "is_stop_location": False},
    {"lat": 65.2622588, "long": -14.0179538, "name": "Seydisfjordur", "is_stop_location": True},
    {"lat": 65.2640083, "long": -14.4037548, "name": "Egilsstadir", "is_stop_location": True},
    {"lat": 66.0427545, "long": -17.3624953, "name": "Husavik", "is_stop_location": True},
    {"lat": 65.659786, "long": -20.723364, "is_stop_location": False},
    {"lat": 65.3958953, "long": -20.9580216, "name": "Hvammstangi", "is_stop_location": True},
    {"lat": 65.0722555, "long": -21.9704238, "is_stop_location": False},
    {"lat": 65.0189519, "long": -22.8767959, "is_stop_location": False},
    {"lat": 64.8929619, "long": -23.7260926, "name": "Olafsvik", "is_stop_location": True},
    {"lat": 64.785334, "long": -23.905765, "is_stop_location": False},
    {"lat": 64.174537, "long": -21.6480148, "name": "Mosfellsdalur", "is_stop_location": True},
    {"lat": 64.0792223, "long": -20.7535337, "name": "Minniborgir", "is_stop_location": True},
    {"lat": 64.14586, "long": -21.93955, "name": "Reykjavik", "is_stop_location": True},
]
In the server.py file, we’ll declare a function to create GeoJSON objects for markers.
These marker objects will have the latitude, longitude and different properties such as title, icon, marker color and the number of marker along the way.
The new function will look like this:
# server.py

def create_stop_locations_details():
    stop_locations = []
    for location in ROUTE:
        # Skip anything that is not a stop location
        if not location["is_stop_location"]:
            continue
        # Create a geojson object for stop location
        point = Point([location['long'], location['lat']])
        properties = {
            'title': location['name'],
            'icon': 'campsite',
            'marker-color': '#3bb2d0',
            'marker-symbol': len(stop_locations) + 1
        }
        feature = Feature(geometry = point, properties = properties)
        stop_locations.append(feature)
    return stop_locations

@app.route('/mapbox_js')
def mapbox_js():
    route_data, waypoints = get_route_data()

    stop_locations = create_stop_locations_details()

    return render_template('mapbox_js.html',
        ACCESS_KEY=MAPBOX_ACCESS_KEY,
        route_data=route_data,
        stop_locations = stop_locations
    )
In the template, we’ll set a new feature layer with the stop locations data:
// templates/mapbox_js.html
L.mapbox.accessToken = '{{ACCESS_KEY}}';
var map = L.mapbox.map('map', 'mapbox.streets', {
scrollWheelZoom: false,
zoomControl: false
}).setView([65.0,-18.73], 7);
L.mapbox.featureLayer({{ route_data|safe }}).addTo(map);
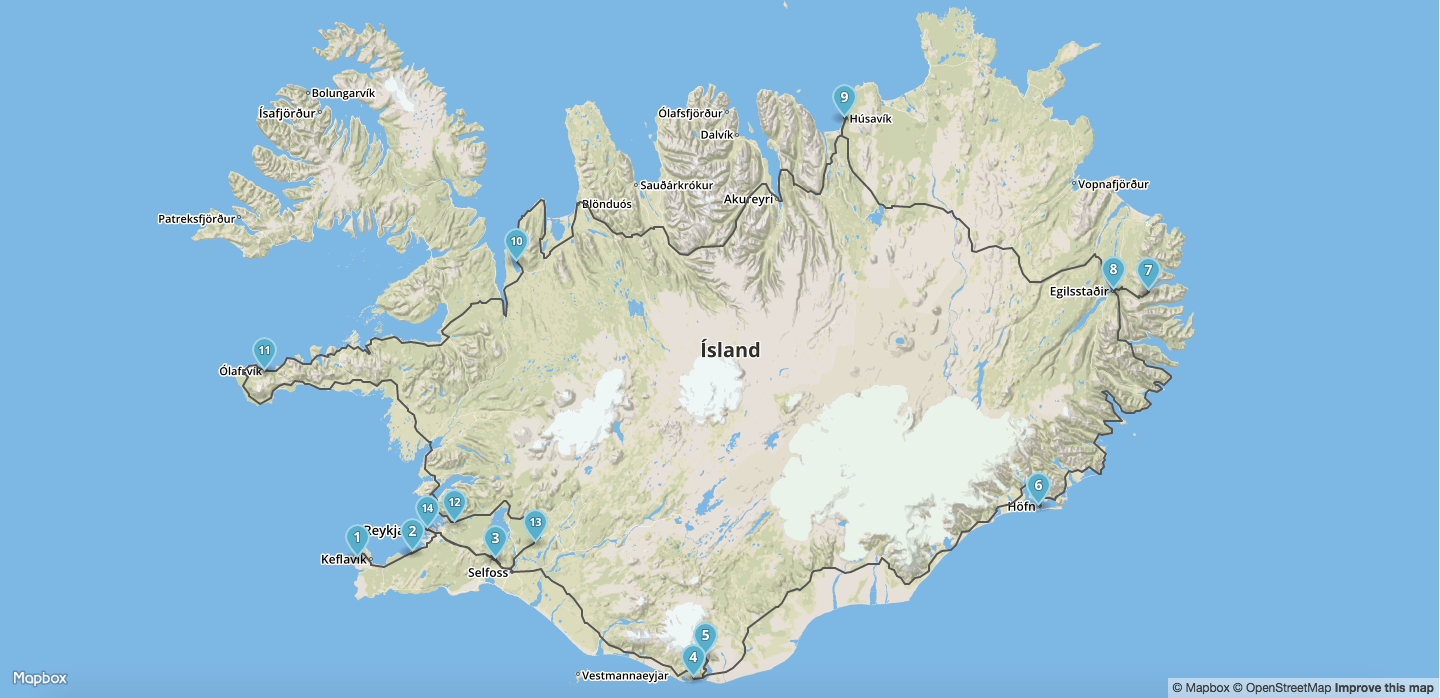
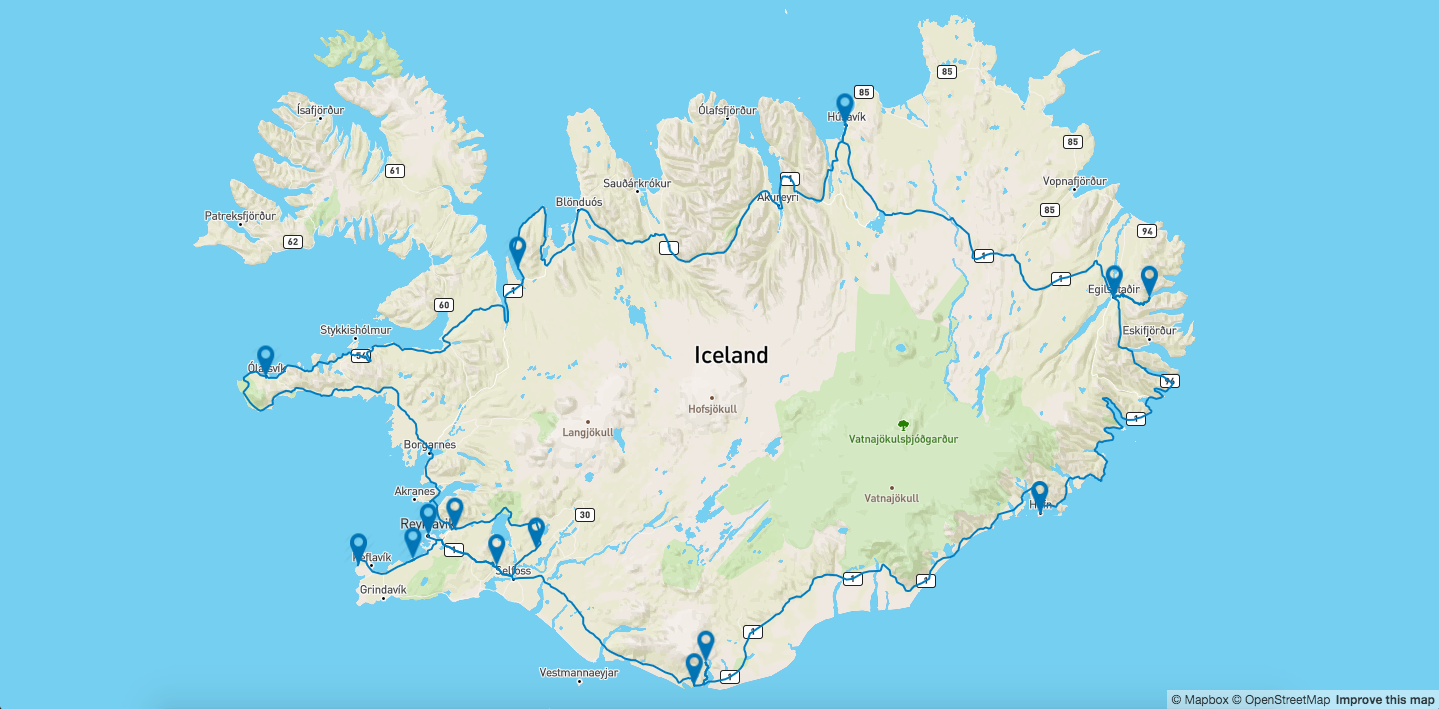
L.mapbox.featureLayer({{stop_locations|safe}}).addTo(map);Go to http://127.0.0.1:5000/mapbox_js again will show the map of Iceland with the route and markers for the stop locations.

Mapbox.js to Mapbox GL
Some time ago, Mapbox released a new framework, Mapbox GL.
While Mapbox GL is still considered a new framework, it might be the future replacement for Mapbox.js (Leaflet plugin).
In this part, we will convert our code to user Mapbox GL and show some of the differences between the two frameworks.
We’ll start by creating a new function in server.py that will route to a new template that uses Mapbox GL:
# server.py

@app.route('/mapbox_gl')
def mapbox_gl():
    return render_template(
        'mapbox_gl.html',
        ACCESS_KEY=MAPBOX_ACCESS_KEY
    )
Create a new template templates/mapbox_gl.html and add the following code:
<!-- templates/mapbox_gl.html -->

<html>
    <head>
        <meta charset='utf-8' />
        <title></title>
        <meta name='viewport' content='initial-scale=1,maximum-scale=1,user-scalable=no' />
        <script src='https://api.tiles.mapbox.com/mapbox-gl-js/v0.24.0/mapbox-gl.js'></script>
        <link href='https://api.tiles.mapbox.com/mapbox-gl-js/v0.24.0/mapbox-gl.css' rel='stylesheet' />
        <script type="text/javascript" src="https://code.jquery.com/jquery-2.1.4.min.js"></script>
        <style>
            body { margin:0; padding:0; }
            #map { position:absolute; top:0; bottom:0; width:100%; }
        </style>
    </head>
    <body>
        <div id='map'></div>
        <script>
            mapboxgl.accessToken = '{{ ACCESS_KEY }}';
            var map = new mapboxgl.Map({
                container: 'map',
                style: 'mapbox://styles/mapbox/streets-v9',
                center: [-18.73, 65.0],
                zoom: 6
            });
            map.scrollZoom.disable();
        </script>
    </body>
</html>
This time we use the mapbox-gl JavaScript and CSS.
In the JavaScript section we’ll create a new mapboxgl.Map object.
the mapboxgl object is set with the id of the relevant div, the style of the map, latitude and longitude of the center of Iceland and the zoom level for the map.
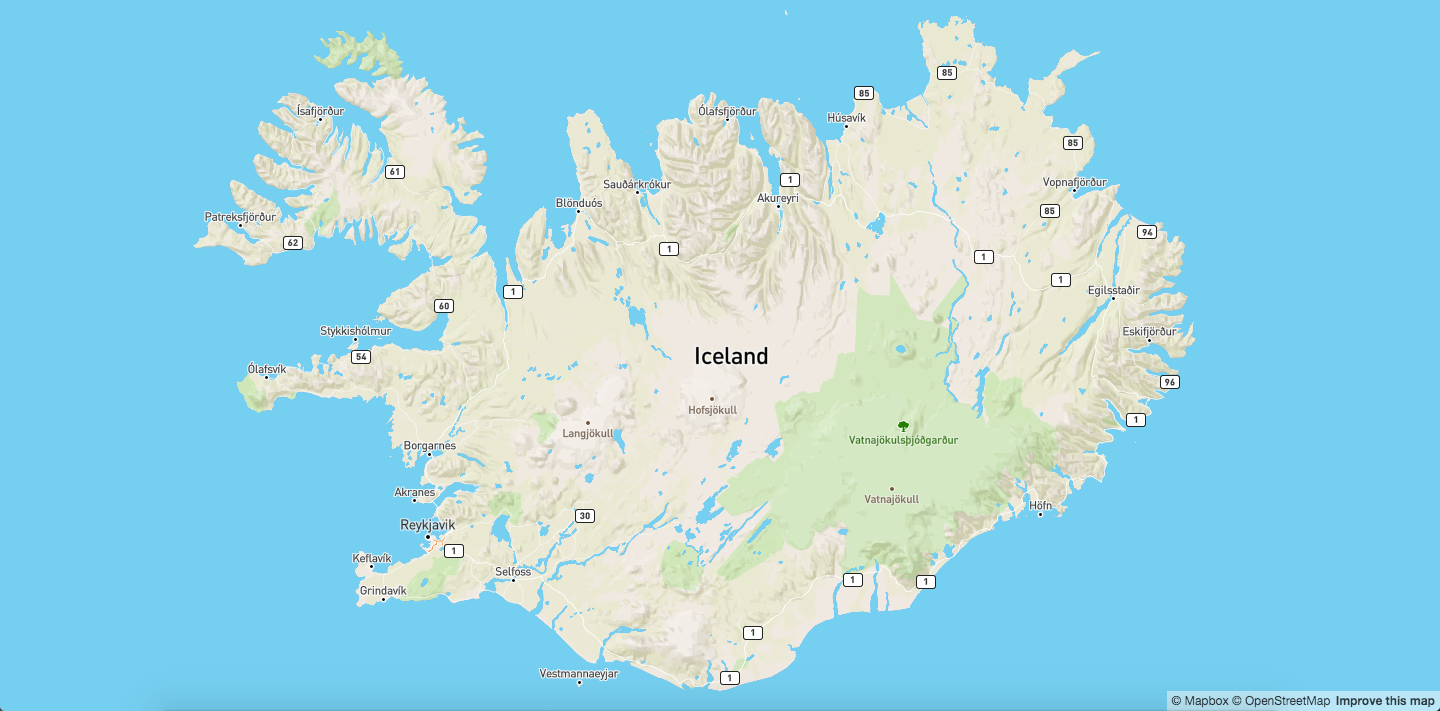
Going to http://127.0.0.1:5000/mapbox_gl will show the map of iceland.
Add the route data using the same get_route_data function that we used previously:
# server.py

@app.route('/mapbox_gl')
def mapbox_gl():
    route_data = get_route_data()

    return render_template('mapbox_gl.html',
        ACCESS_KEY=MAPBOX_ACCESS_KEY,
        route_data = route_data
    )
In the mapbox_gl.html template, add the following to the JavaScript section after the initialization of the map object.
This time, in the JavaScript part of the HTML we first create a source with the routing data for the map and then we add a layer using the source object that we just created.
// templates/mapbox_gl.html
route = {{route_data|safe}}
map.on('load', function () {
map.addSource("route", {
"type": "geojson",
"data": route
});
map.addLayer({
"id": "route",
"type": "line",
"source": "route",
"layout": {
"line-join": "round",
"line-cap": "round"
},
"paint": {
"line-color": "#007cbf",
"line-width": 2
}
});
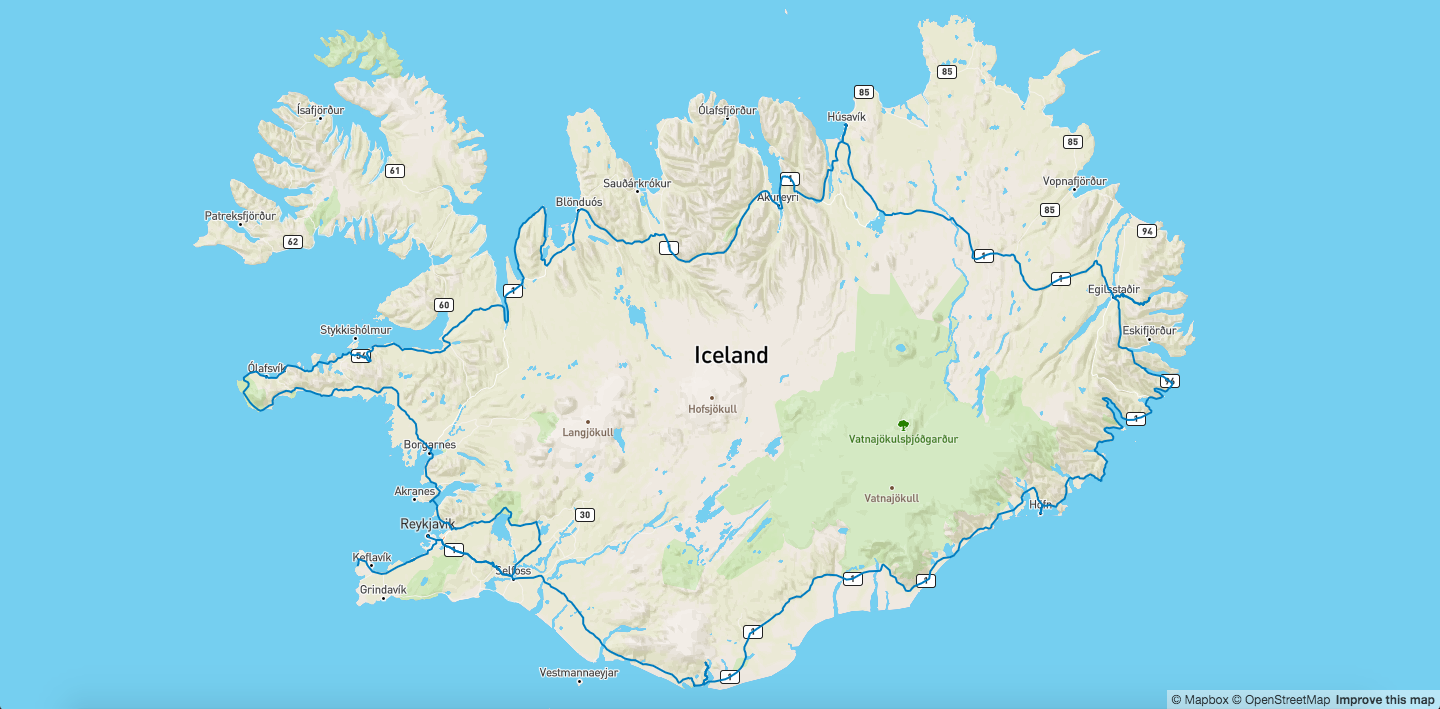
});Going to http://127.0.0.1:5000/mapbox_gl will show the map of Iceland with the route drawn along the ring road:
Adding the markers is a bit different with Mapbox GL, as it is more of a manual process.
From the server side, we send the markers in the same way as we did before:
# server.py

@app.route('/mapbox_gl')
def mapbox_gl():
    route_data = get_route_data()

    stop_locations = create_stop_locations_details()

    return render_template('mapbox_gl.html',
        ACCESS_KEY=MAPBOX_ACCESS_KEY,
        route_data = route_data,
        stop_locations = stop_locations
    )
On the HTML side, in templates/mapbox_gl.html add the following css:
/* mapbox_gl.html */

.marker {
    border: none;
    cursor: pointer;
    height: 32px;
    width: 32px;
    background-image: url(static/marker.png);
    background-color: rgba(0, 0, 0, 0);
    transform: translate(28px, 56px, 0);
}
The configuration uses a file called marker.png which can be found in my Github repository.
Put marker.png in the templates folder.
In the JavaScript part of templates/mapbox_gl.html, load the stop locations data structure and add a marker for each stop location.
// mapbox_gl.html

map.on('load', function () {
    // Add this to end of function
    var stop_locations = {{ stop_locations|safe }}
    stop_locations.forEach(function(marker) {
        var el = document.createElement('div');
        el.className = 'marker';
        el.style.left = '-15px';
        el.style.top = '-32px';

        new mapboxgl.Marker(el)
            .setLngLat(marker.geometry.coordinates)
            .addTo(map);
    });
});
Going to http://127.0.0.1:5000/mapbox_gl will show the map of Iceland with the route along the ring road, and with markers in the stop locations:
Adding map animations
We can also add an animation on top of our map. For this example, we will add an animation of a car going through the route between the stop locations.
We start by adding a new source and layer for the car icon that we will animate across the route.
On the client side, add the following code to the JavaScript section in mapbox_gl.html inside the map load function:
// mapbox_gl.html

// ***********************************************
// Add the following code in beginning of the file
// ***********************************************

// Add points for start and end of animation
var origin = route.geometry.coordinates[0];
var destination = route.geometry.coordinates[route.geometry.coordinates.length - 1];

var point = {
    "type": "FeatureCollection",
    "features": [{
        "type": "Feature",
        "geometry": {
            "type": "Point",
            "coordinates": origin
        }
    }]
};

map.on('load', function () {

    // *********************************************
    // Add the following code to end of the function
    // *********************************************

    // Add source for the car icon layer
    map.addSource('point', {
        "type": "geojson",
        "data": point
    });

    // Add car icon layer
    map.addLayer({
        "id": "point",
        "source": "point",
        "type": "symbol",
        "layout": {
            "icon-image": "car-15",
            "icon-size": 1,
        }
    });
});
Add the animation function for moving the car along the route:
// mapbox_gl.html

// ***********************************************
// Add the following code in beginning of the file
// ***********************************************

var counter = 0;

map.on('load', function () {

    // *********************************************
    // Add the following code to end of the function
    // *********************************************

    function animate() {
        point.features[0].geometry.coordinates = route.geometry.coordinates[counter]
        map.getSource('point').setData(point);

        if (point.features[0].geometry.coordinates[0] !== destination[0]) {
            requestAnimationFrame(animate);
        }

        counter = counter + 1;
    }

    animate();
});
On the server side, we need to add a couple of additional details to the stop locations so we can move the car between them.
Add the following code to the server side:
# server.py

@app.route('/mapbox_gl')
def mapbox_gl():
    route_data, waypoints = get_route_data()

    stop_locations = create_stop_locations_details()

    # For each stop location, add the waypoint index
    # that we got from the route data
    for stop_location in stop_locations:
        waypoint_index = stop_location.properties["route_index"]
        waypoint = waypoints[waypoint_index]
        stop_location.properties["location_index"] = route_data['geometry']['coordinates'].index(waypoint["location"])

    return render_template('mapbox_gl.html',
        ACCESS_KEY=MAPBOX_ACCESS_KEY,
        route_data = route_data,
        stop_locations = stop_locations
    )
On the client side, we’ll add buttons that will control the location of the car on the route
// mapbox_gl.html
// ***********************************************
// Add the following code in beginning of the file
// ***********************************************
var counter = 0;
map.on('load', function () {
// *****************************************************************
// Add the following code to end of stop_locations for each function
// *****************************************************************
stop_locations.forEach(function(marker, index) {
// Create location buttons
var button = document.createElement('button');
button.className = 'location_btn';
button.value = marker.properties.location_index;
button.innerHTML = "Day " + (index + 1) + " - " + marker.properties.title;
$(".overlay").append(button)
});
// *********************************************
// Add the following code to end of the function
// *********************************************
// Control the location of the car icon
$(".location_btn").click(function() {
// Get the location index from the button value
var location_index = Number($(this).val());
// Set the location of the car point on the route coordinate
point.features[0].geometry.coordinates = route.geometry.coordinates[location_index];
map.getSource('point').setData(point);
// Start the animation from that index
counter = location_index;
animate(counter);
});
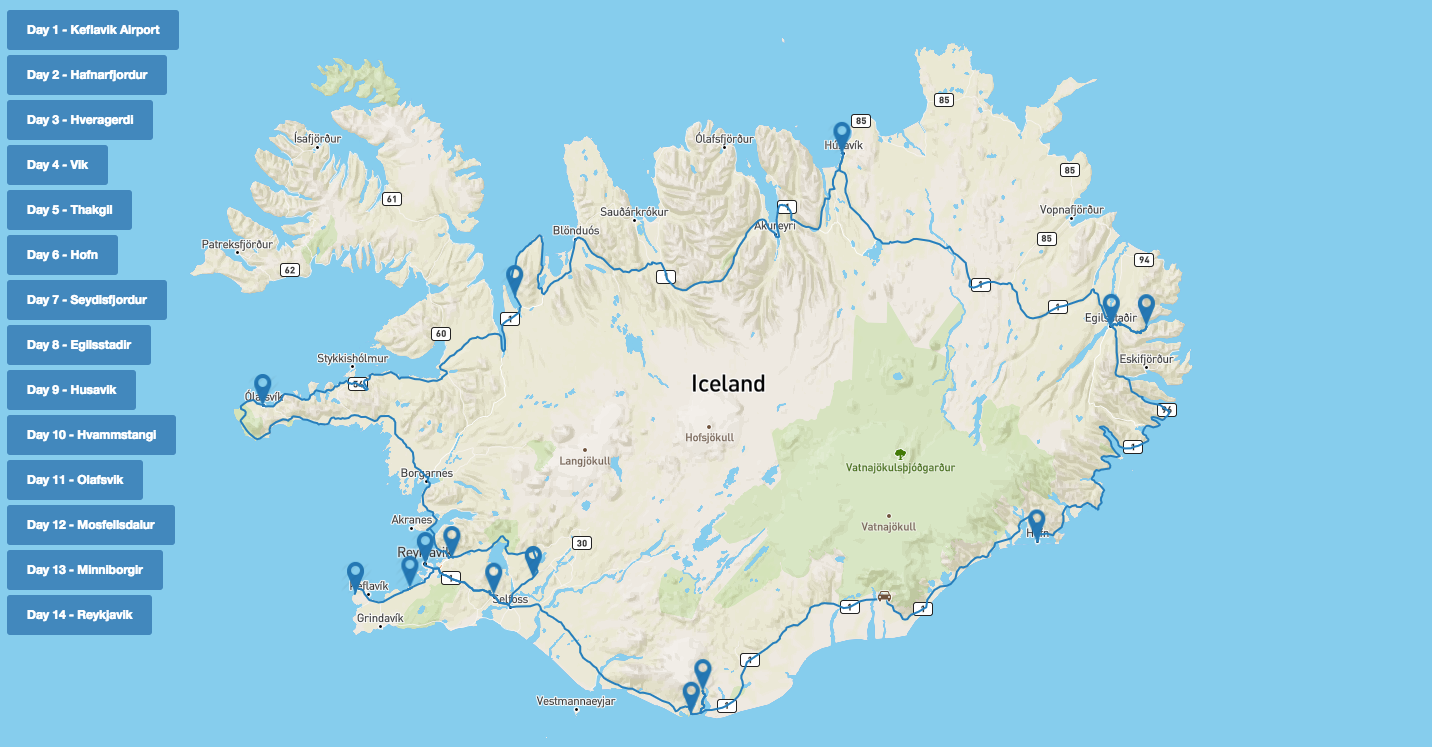
});Going to http://127.0.0.1:5000/mapbox_gl will show the map and the animation:
Full code can be found on Github.